The Challenge

Why Kubernetes Operations
Are Challenging

As Kubernetes environments scale, operational complexity grows with them.
Four key challenges can hold IT operations teams back:

hub
Cluster Complexity
Increasing complexity as K8s environments scale
visibility_off
Limited Visibility
Difficulty achieving end-to-end visibility
data_usage
Resource Waste
Inefficient resource management
autorenew
Operational Burden
Growing operational overhead and management effort
Beyond Monitoring

One Platform
for the Entire
Kubernetes Lifecycle

onTune brings observability, analysis, and protection together in one platform.

Observe
Observe / Monitor
Complete Kubernetes Visibility
check Monitor cluster, node, and pod status
check Collect CPU, memory, network, and storage metrics
check Collect and analyze Kubernetes events
check Multi-view dashboards
check Gain namespace and workload visibility
Explain
Analyze
From Data to Operational Insight
check Kubernetes Topology Analysis
check Event-based root cause tracking
check Resource Usage Trend Analysis
check Analyze object change history
check Assess the impact across services
Recover
Protect
Backup & Recovery for Business Continuity
check Application-aware Backup
check Namespace-level recovery
check Cluster Migration Support
check Disaster recovery support
check Automate data protection and restoration
The Platform

All-in-One Kubernetes Platform

Everything you need to operate Kubernetes—from real-time monitoring and analysis to event management and backup.

Overview

Gain real-time visibility into your entire Kubernetes environment and quickly detect potential issues.
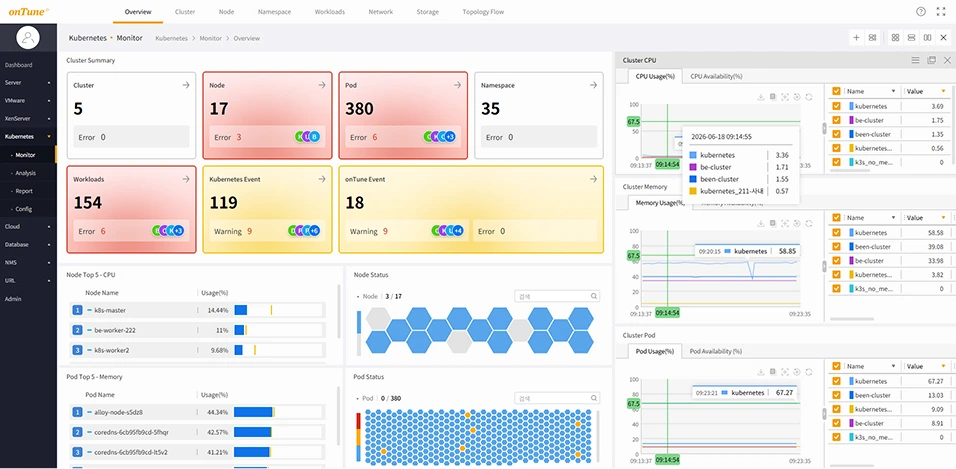
check_circle Monitor cluster, node, pod, and namespace status from a single view
check_circle Track key metrics such as CPU, memory, and pod availability
check_circle Monitor resource usage and anomalies in real time
check_circle Detect state changes through Kubernetes events
check_circle View operational status at a glance with a summary dashboard
onTune · Overview
Cluster Health

Multi-layer Visibility

View and analyze Kubernetes data across multiple layers, from clusters to workloads.
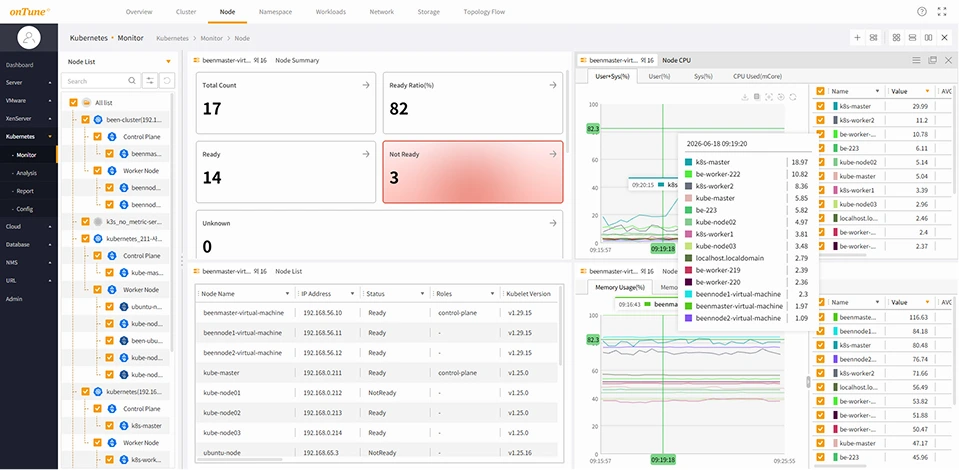
check_circle Get detailed visibility across clusters, nodes, namespaces, and workloads
check_circle Analyze performance and health across hierarchical Kubernetes resources
check_circle Maintain consistent visibility as your Kubernetes environment scales
check_circle Compare performance and status across multiple clusters
check_circle Quickly identify the scope and impact of issues
onTune · Multi-layer Visibility
Multi-layer Visibility

Kubernetes Analytics

Turn collected data into in-depth Kubernetes analysis and actionable operational insights.
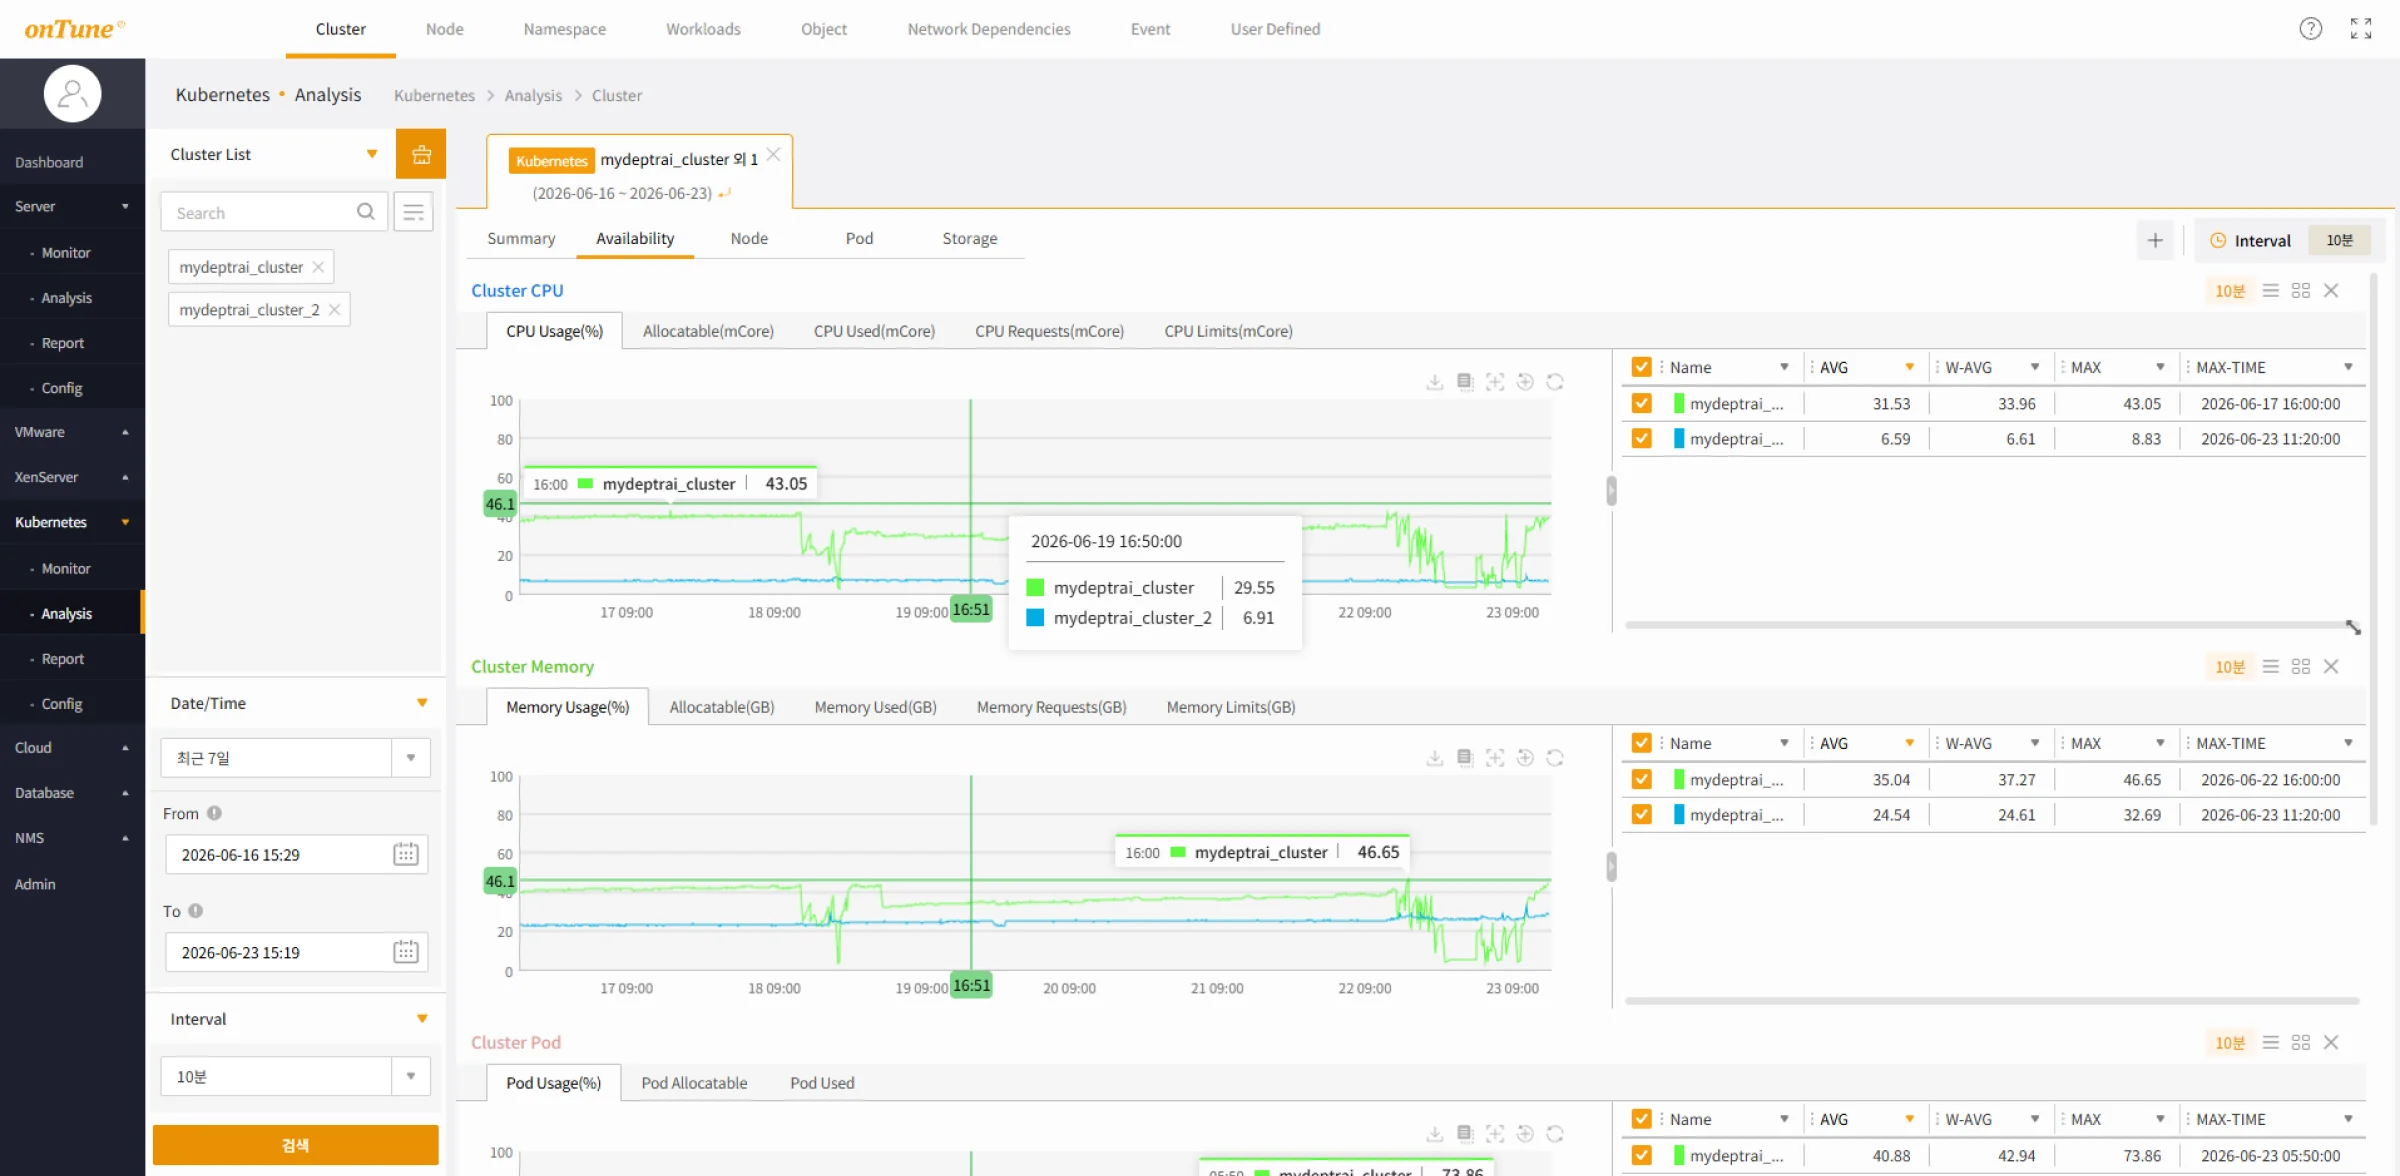
check_circle Analyze performance data and event history
check_circle Track configuration changes across Kubernetes objects
check_circle Compare performance across different time periods
check_circle Identify root causes of failures and performance issues
check_circle Detect operational patterns and anomalies
onTune · Analytics
Kubernetes Analytics

Event & Report

Automatically detect critical events and notify operators in real time.
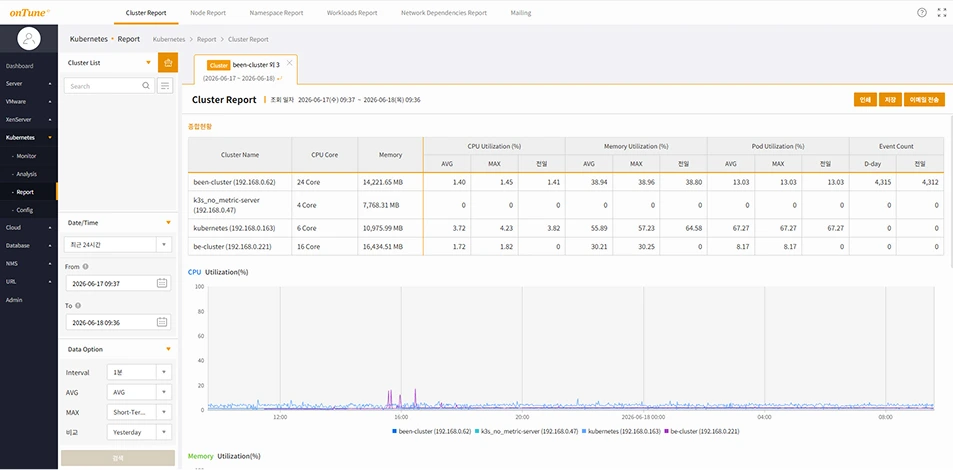
check_circle Configure events at the cluster, node, and pod levels
check_circle Detect events based on conditions such as CPU, memory, and network metrics
check_circle Generate alerts based on Kubernetes event logs
check_circle Trigger real-time alerts based on defined thresholds
check_circle Customize event rules to match your operational policies
onTune · Event & Report
Event & Report

Backup & Recovery

Protect Kubernetes applications and data from unexpected failures, operational errors, and ransomware attacks.
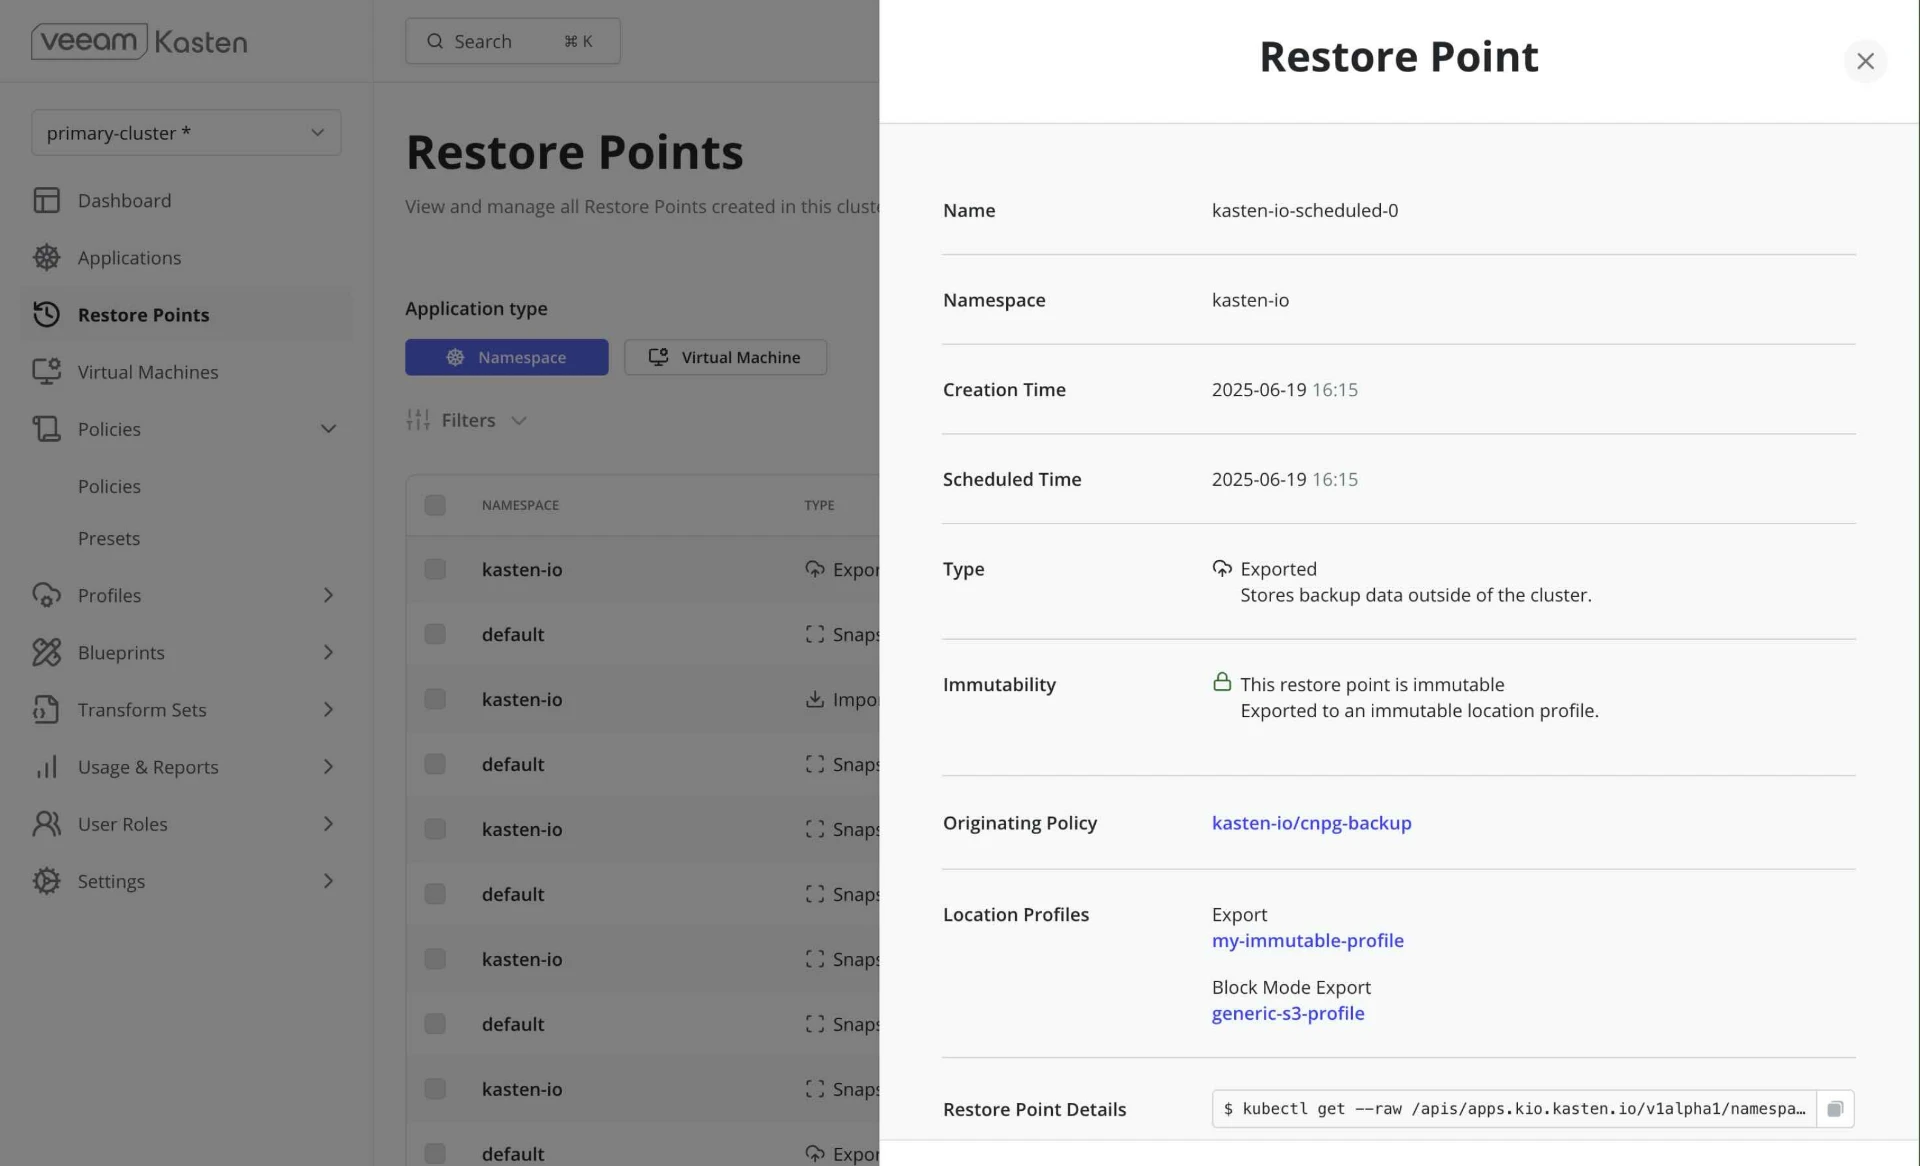
check_circle Centralized backup for applications and data
check_circle Policy-based automated backup and recovery management
check_circle Migrate applications across clusters
check_circle Enable rapid recovery and service restoration after a disaster
check_circle Protect workloads across multi-cluster and hybrid environments
onTune · Backup & Recovery
Backup & Recovery